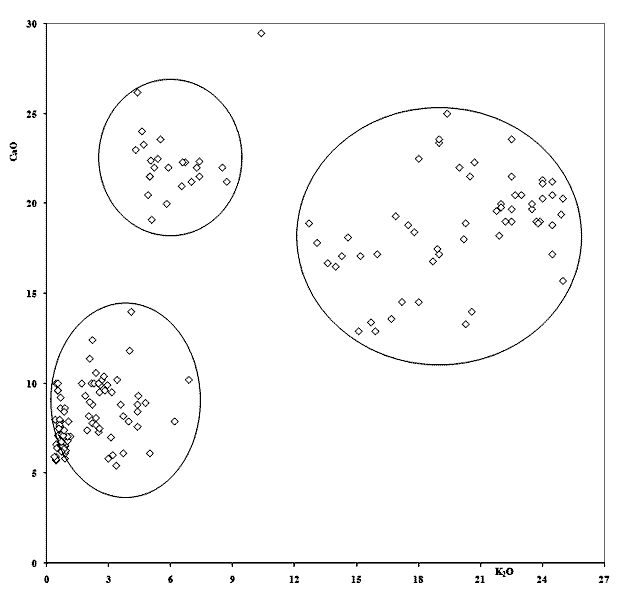
Figure 1 – Graph of CaO versus K2O for all the analysed samples
The clustering of the compositional groups was based on major and minor oxides concentration of the analysed samples which were, plotted in graphs similar to that reported in Figure 1 (CaO versus K2O). The ellipses on the graph reveal that among the analysed glasses there are three distinguishable groups. 26 samples belong to a high-lime, low-potash group (ellipse at the top of figure 1) arbitrarily called group Ca, 56 to a broad high-lime, high-potash group (ellipse on the right of figure 1) and 94 samples to a low-lime low-potash group. This last group corresponds to soda-lime-silica glass.

