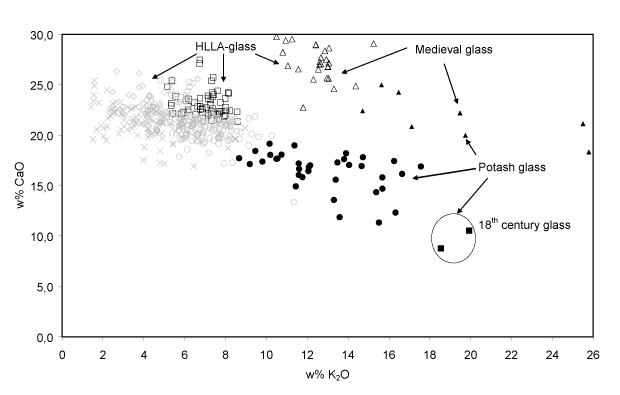
Fig. 5: Scatter plot of the K2O versus CaO concentrations.
The scatter plot in Fig. 5 illustrates the large compositional variation within the clusters and the small distances that exist between the centres of these clusters. Therefore, it is not surprising that the membership of a sample to a specific cluster depends on the classification method that has been employed. However, clear differences between the average compositions of the clusters were observed. These averages describe the largest compositional variation in the data set and can be explained by the use of different glassmaking recipes or by the use of raw materials with a specific composition. The variation within the clusters is probably caused by compositional variations of the raw materials, by slight fluctuations of the relative amounts of ingredients in the recipe and by the introduction of cullet (recycled glass) with a different composition into the batch.
The symbols are related to the compositional groups of Table I.

